 Products
> OTDR
> mini OTDR
> GLK4500
> common problem
common problem
How To View OTDR Curves
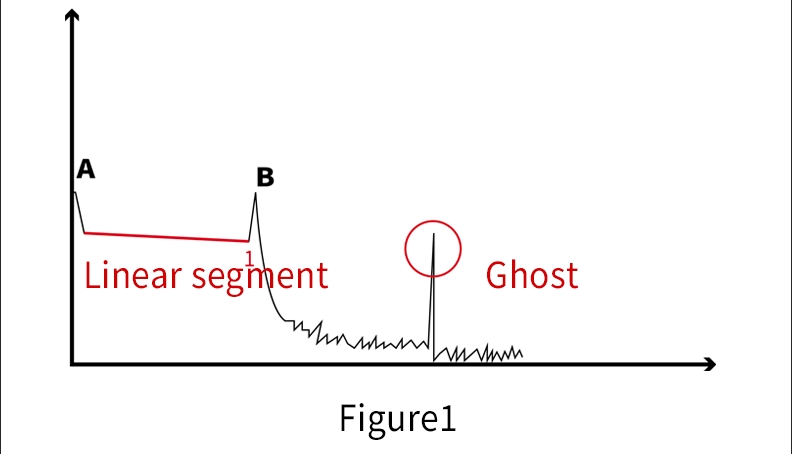
1、Normal curve. Cursor A defaults to the starting point of the fiber, while cursor B defaults to the end of the fiber. After reflecting from the front end of the test curve, a linear descent line can be seen. When the reflection is strong at the end face, secondary reflection (ghosting) can be seen in the curve noise area (see Figure 1)
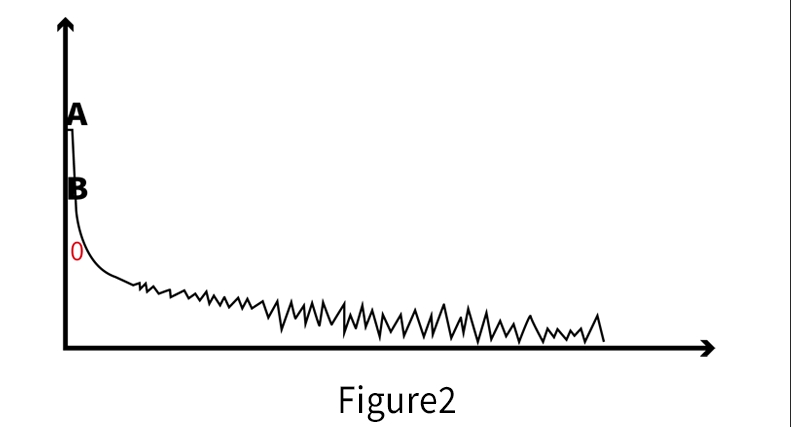
2、No fiber optic detected. The curve did not pass through the linear zone and directly descended into the noise zone, which is likely caused by the fiber optic connector not being properly connected or cleaned. Please clean the fiber optic end face and check if the fiber optic connector is properly connected before retesting. (See Figure 2)
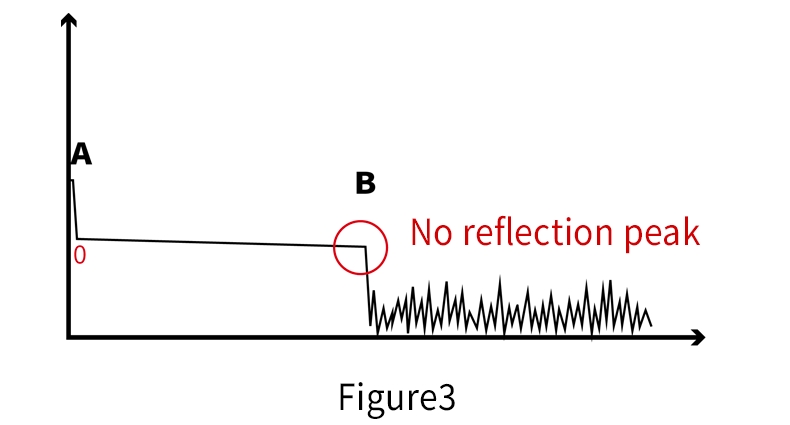
3、The optical fiber is not terminated. If there is no reflection peak or low reflectivity at the end of the fiber, the fiber end may fracture (see Figure 3)
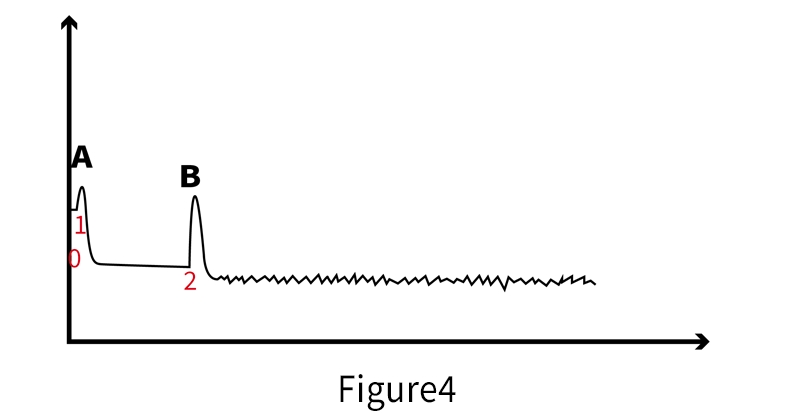
4、Range selection error. When manually testing, if the selected range is smaller than the length of the test fiber and the noise area does not decrease at the end of the curve, a larger range should be selected for retesting (see Figure 4)
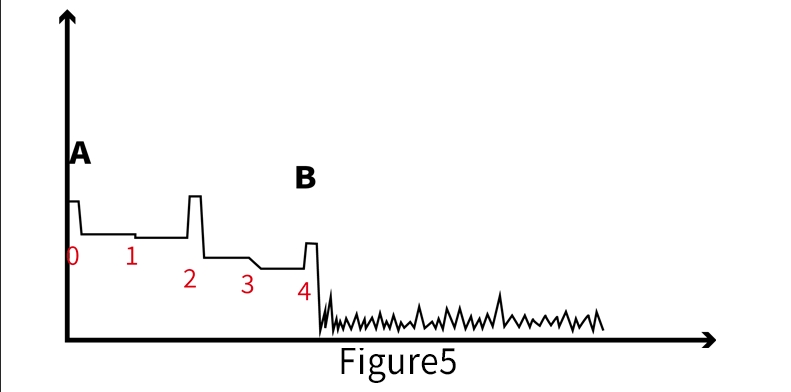
5、Fiber loss is high. Usually, event types are divided into reflective events and non reflective events, with non reflective events further divided into descent events and gain events (with descent being more common). The events 1 and 3 marked in the figure are non reflective events (descent events), and a step (event loss) appears in the middle of the curve. This is usually the fiber optic melting point or bending point. If the loss is too large (greater than the user set threshold), the fiber optic signal transmission will be blocked, so it is necessary to check and handle it in a timely manner. (See Figure 5)
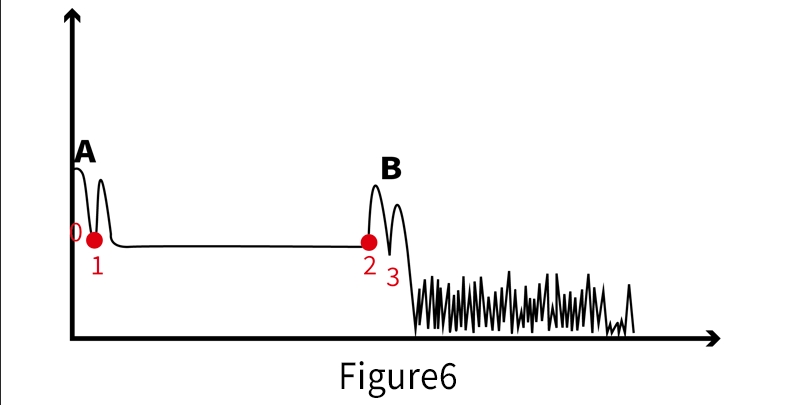
6、Fiber optic connector judgment. There is a large reflection peak in the curve, which is generally believed to be a fiber optic connector, as shown in event 1 and event 2 in the figure. (See Figure 6)
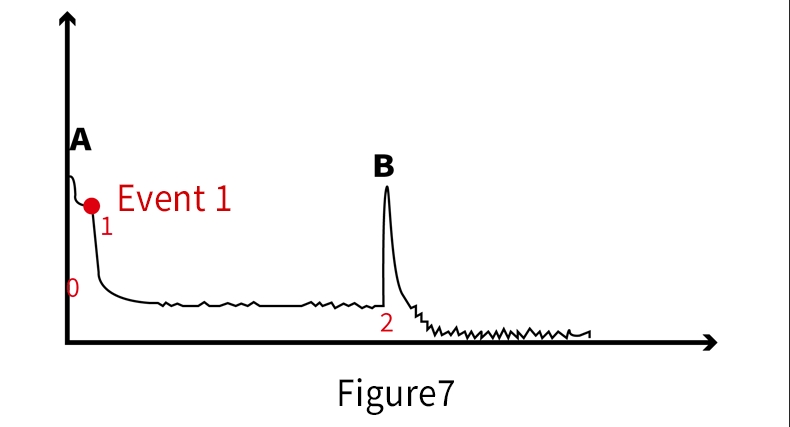
7、Spectrometer judgment. If the line loss is large (as shown in event 1 in the figure), there may be a fiber splitter in the line. (See Figure 7)
How to calibrate a power meter
1.Standard calibration method:
Use a stable light source with known power and connect the output port of the light source to the OPM access port of the device using standard fiber optic jumpers. Open the device power meter function module - calibration, adjust the power value to the output power value of the light source, save and return to complete calibration.
2.User self calibration:
Usually, users do not have a standard stable light source and can perform reference calibration. Use the light source to output to a user approved power meter and obtain the reference power value. Open the power meter module of our device - calibration, adjust the power value to the user's reference power value.
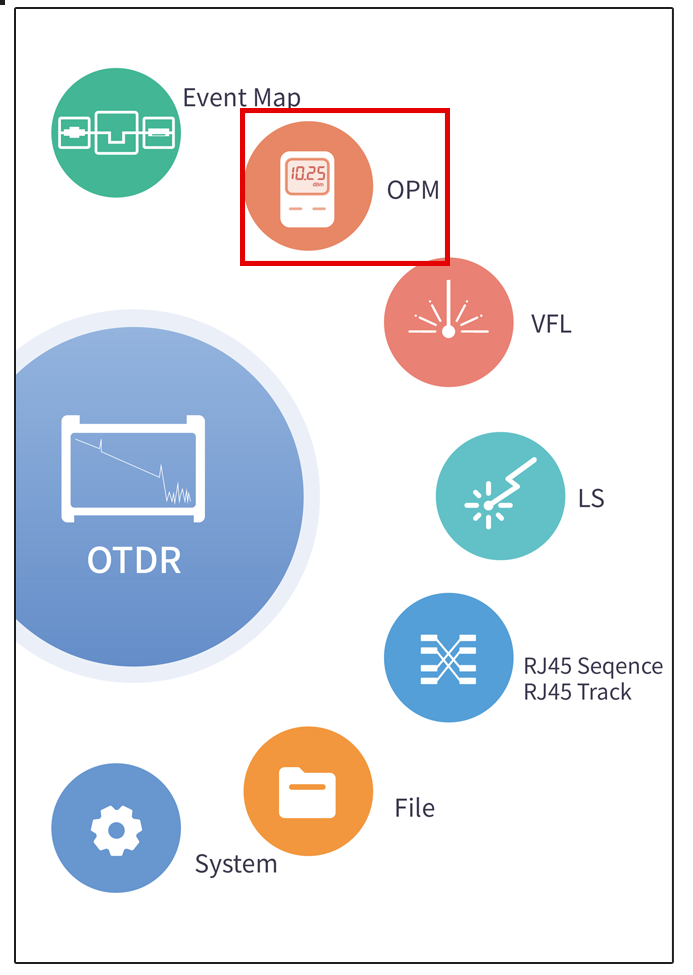
Click to enter the optical power meter module
![]()
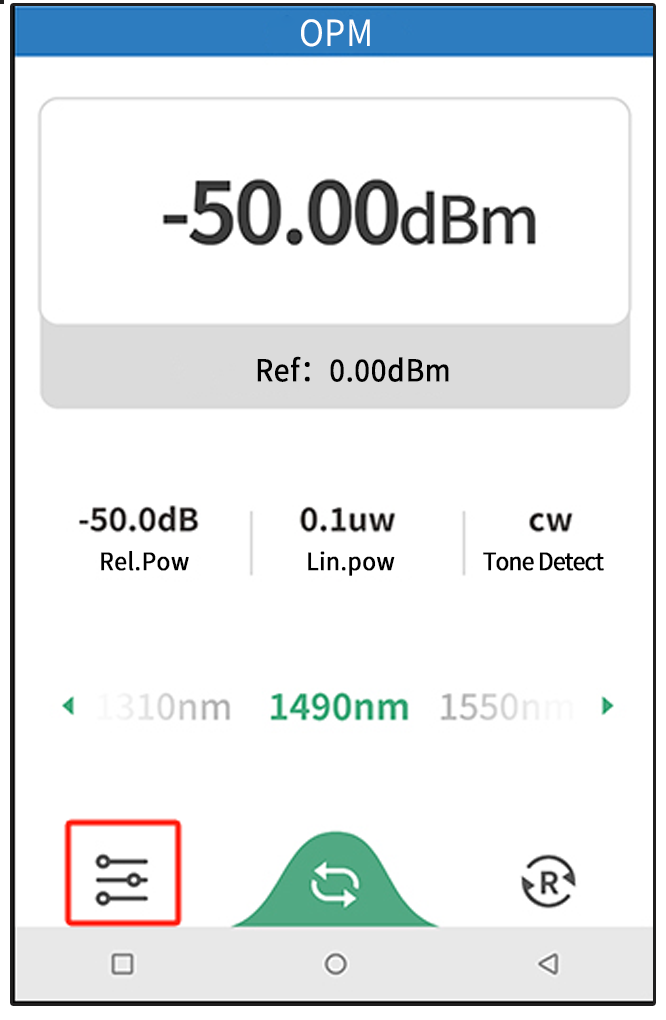
Click on the adjustment in the bottom left corner
![]()
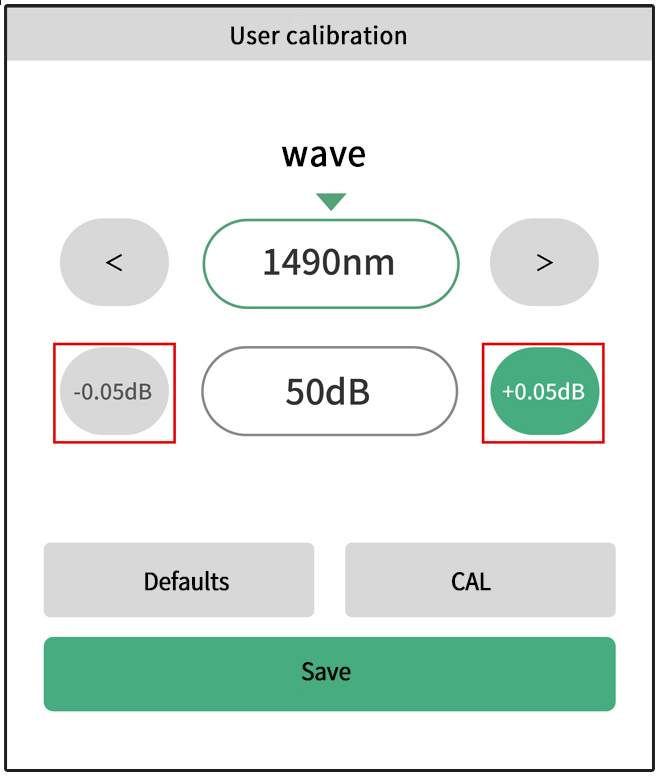
Click on "+0.05dB" and "-0.05dB" to adjust,then click "Calibration" to save. If you need to exit, click "Save and Exit".
How To View Test Results
View the test results through a curve chart and event list (see Figure 1)
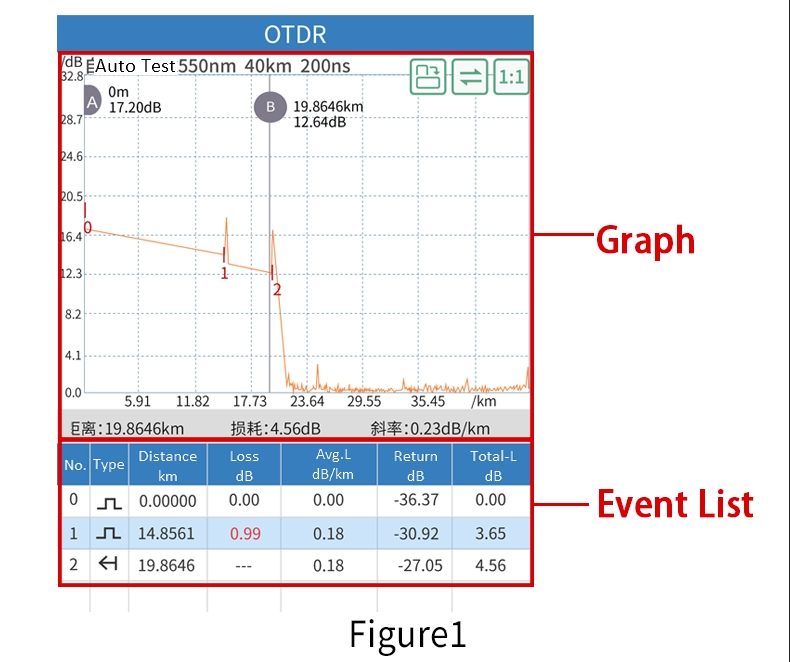
1.Curve chart: presents the overall sampling of all data. On the curve chart, we can visually observe the changes in the curve data. All events are clearly marked on the curve. By zooming in and out to display the curve, we can visually view the data at each event location, and visually view the events (suitable for experienced users).
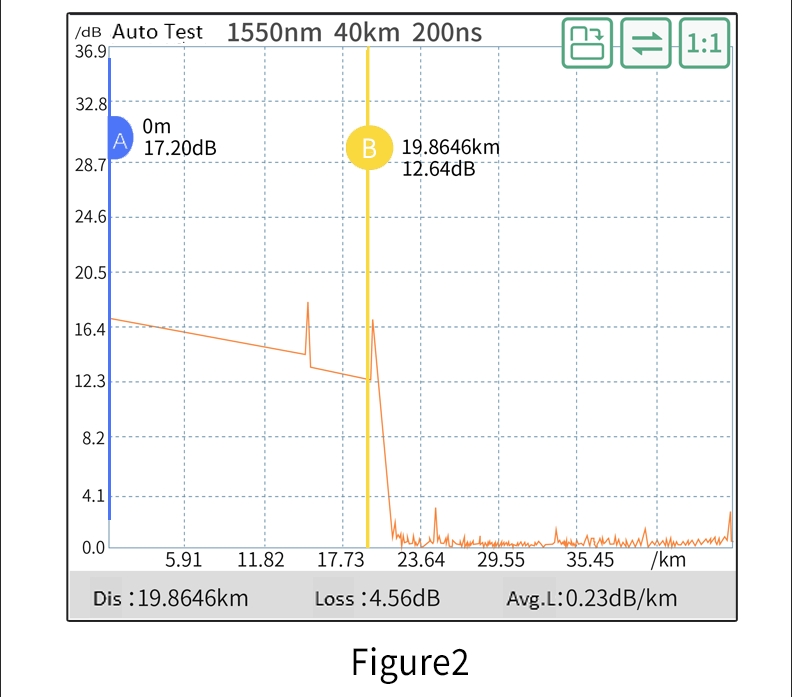
By dragging the marking lines A and B, you can view the position and power value of the AB marking line, and display the distance between AB, loss value, and slope. (See Figure 2)
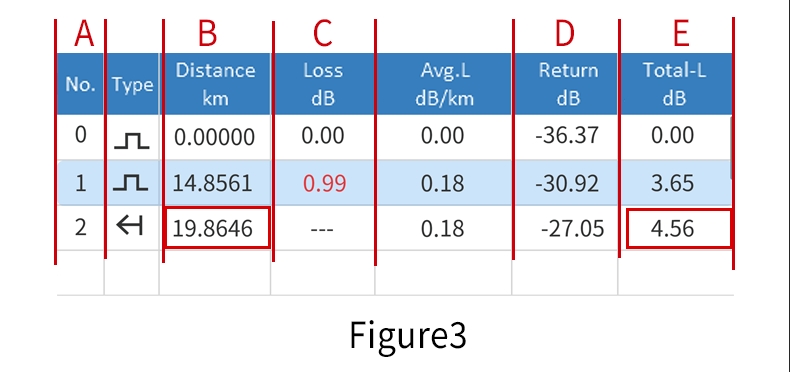
2.Event List:
A. Number of events: The last event number is the number of events (excluding the fiber optic starting point).
B. Total fiber length: The distance displayed for the last event is the total fiber length.
C. Loss point: The loss value of each event can be viewed through the Loss (dB) column. If the loss value is greater than the user set loss threshold, this position needs to be investigated.
D. Reflectivity: The reflectance value of each event is viewed through the Reflectance (dB) column. If the reflectance value is greater than the user set loss threshold, this position needs to be investigated.
E. Total fiber loss: The total loss displayed by the last event is the total loss of the entire fiber optic link.
How To Print Reports
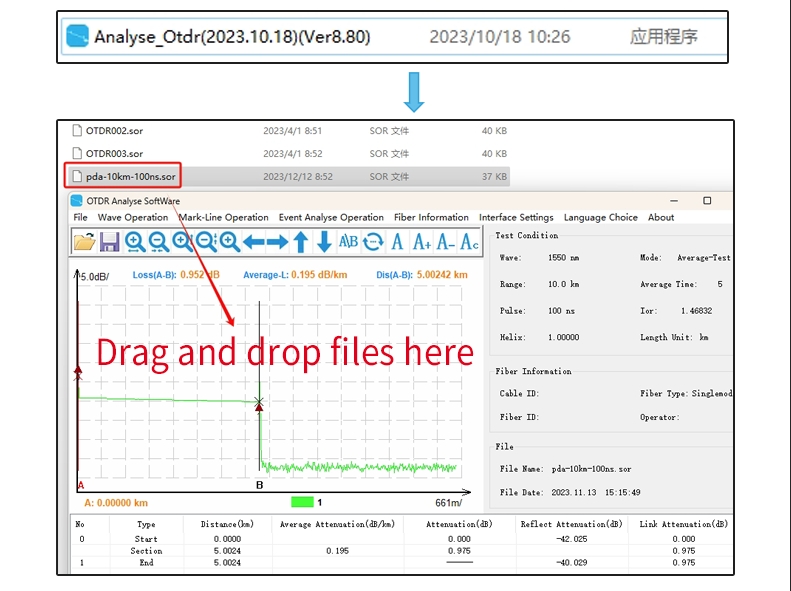
1、Open the OTDR analysis software, drag and drop the SOR file that needs to be printed into the analysis software, and the software will open the test file.
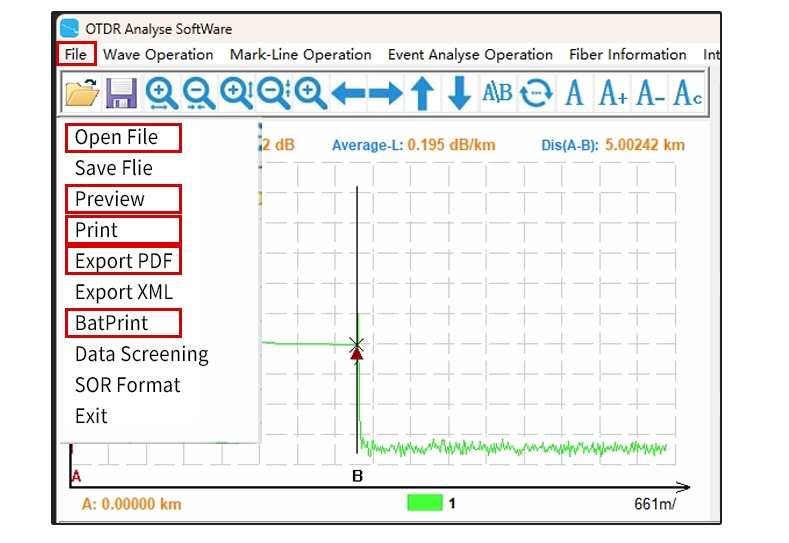
2、Click on the file to select print preview, printing, or batch processing.
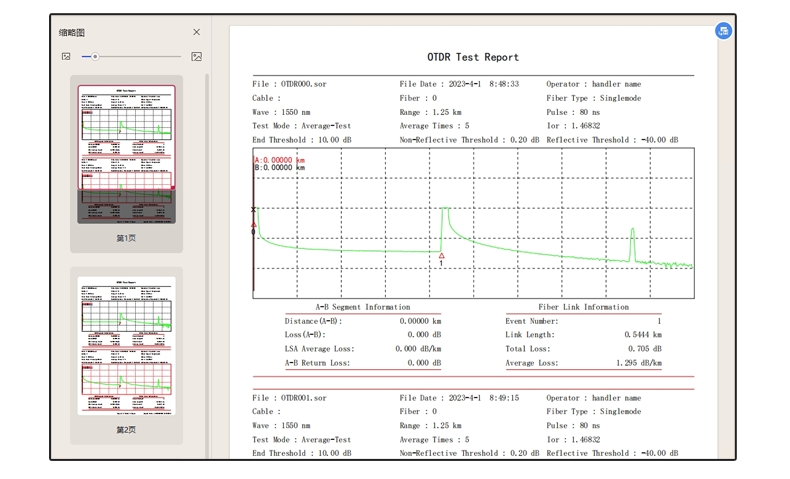
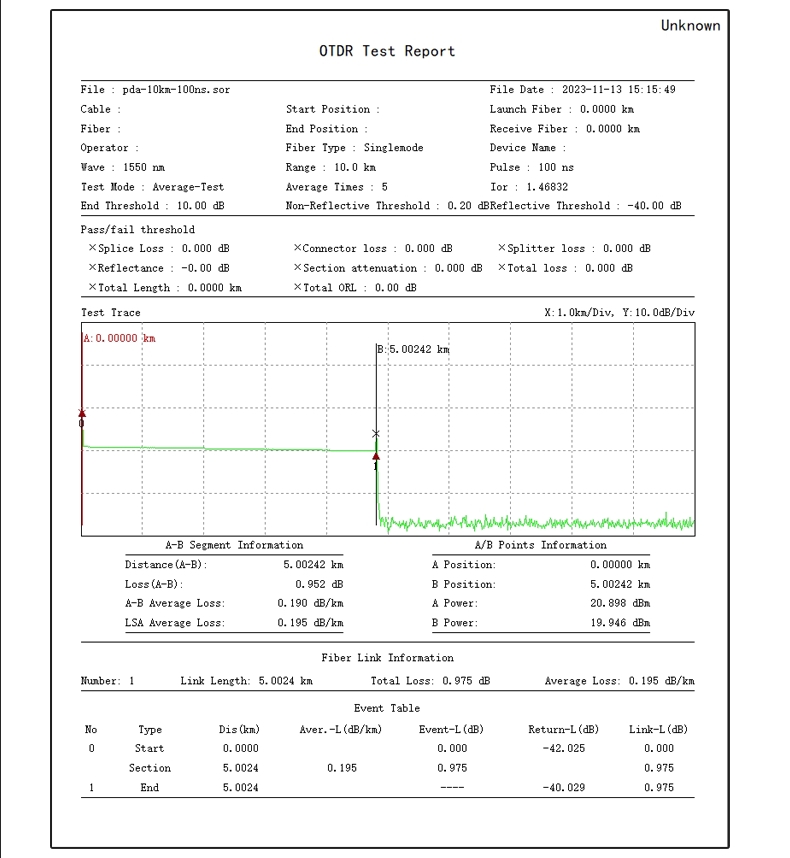
The print preview effect is shown below:
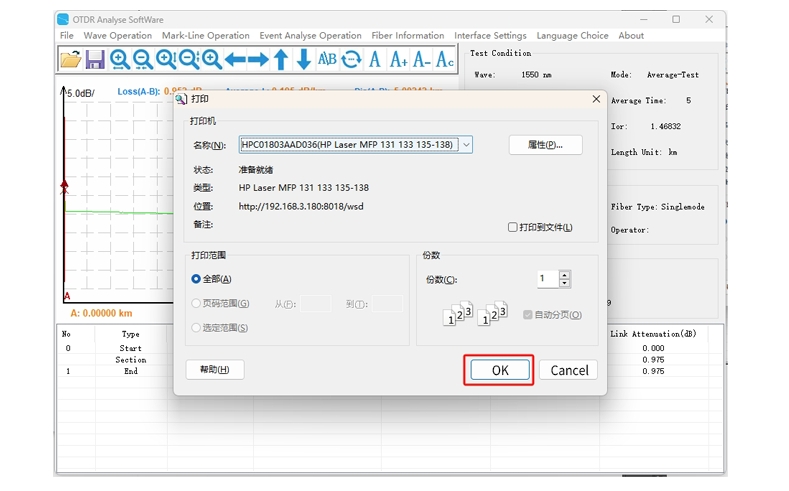
File - Print - OK to print
3、Batch processing allows for batch printing of files. Click on "File" - "Batch Processing" and "Add" the required files for printing and preview.
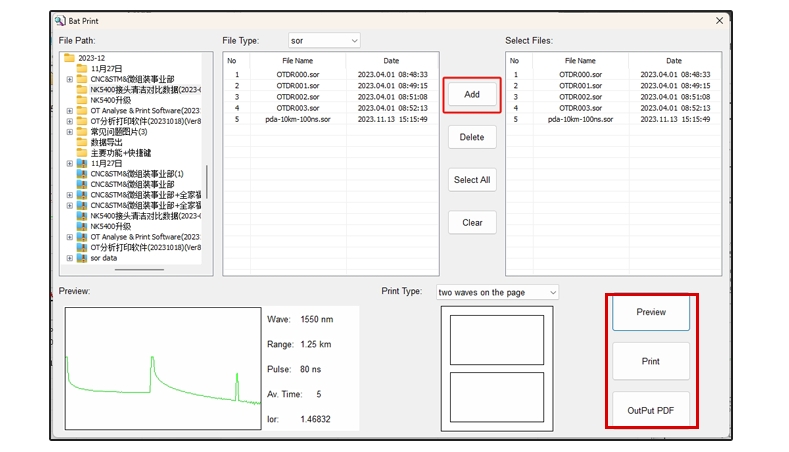
Batch export PDF files as shown in the following figure
